An interactive web application designed to perform statistical hypothesis testing using binomial and chi-square tests. This project focuses on making complex mathematical concepts visually intuitive through real-time coordinate-based rendering.
Project Executive Summary
Translating mathematics
The "Statistical Calculator" was born from a desire to make rigorous data science concepts more accessible. Featuring a chalkboard-inspired interface, it combines complex statistical algorithms with a high-fidelity Canvas-based visualization system.

"Mathematics is the language of the universe; visualization is its translation."
Core Features
Rigorous & Intuitive
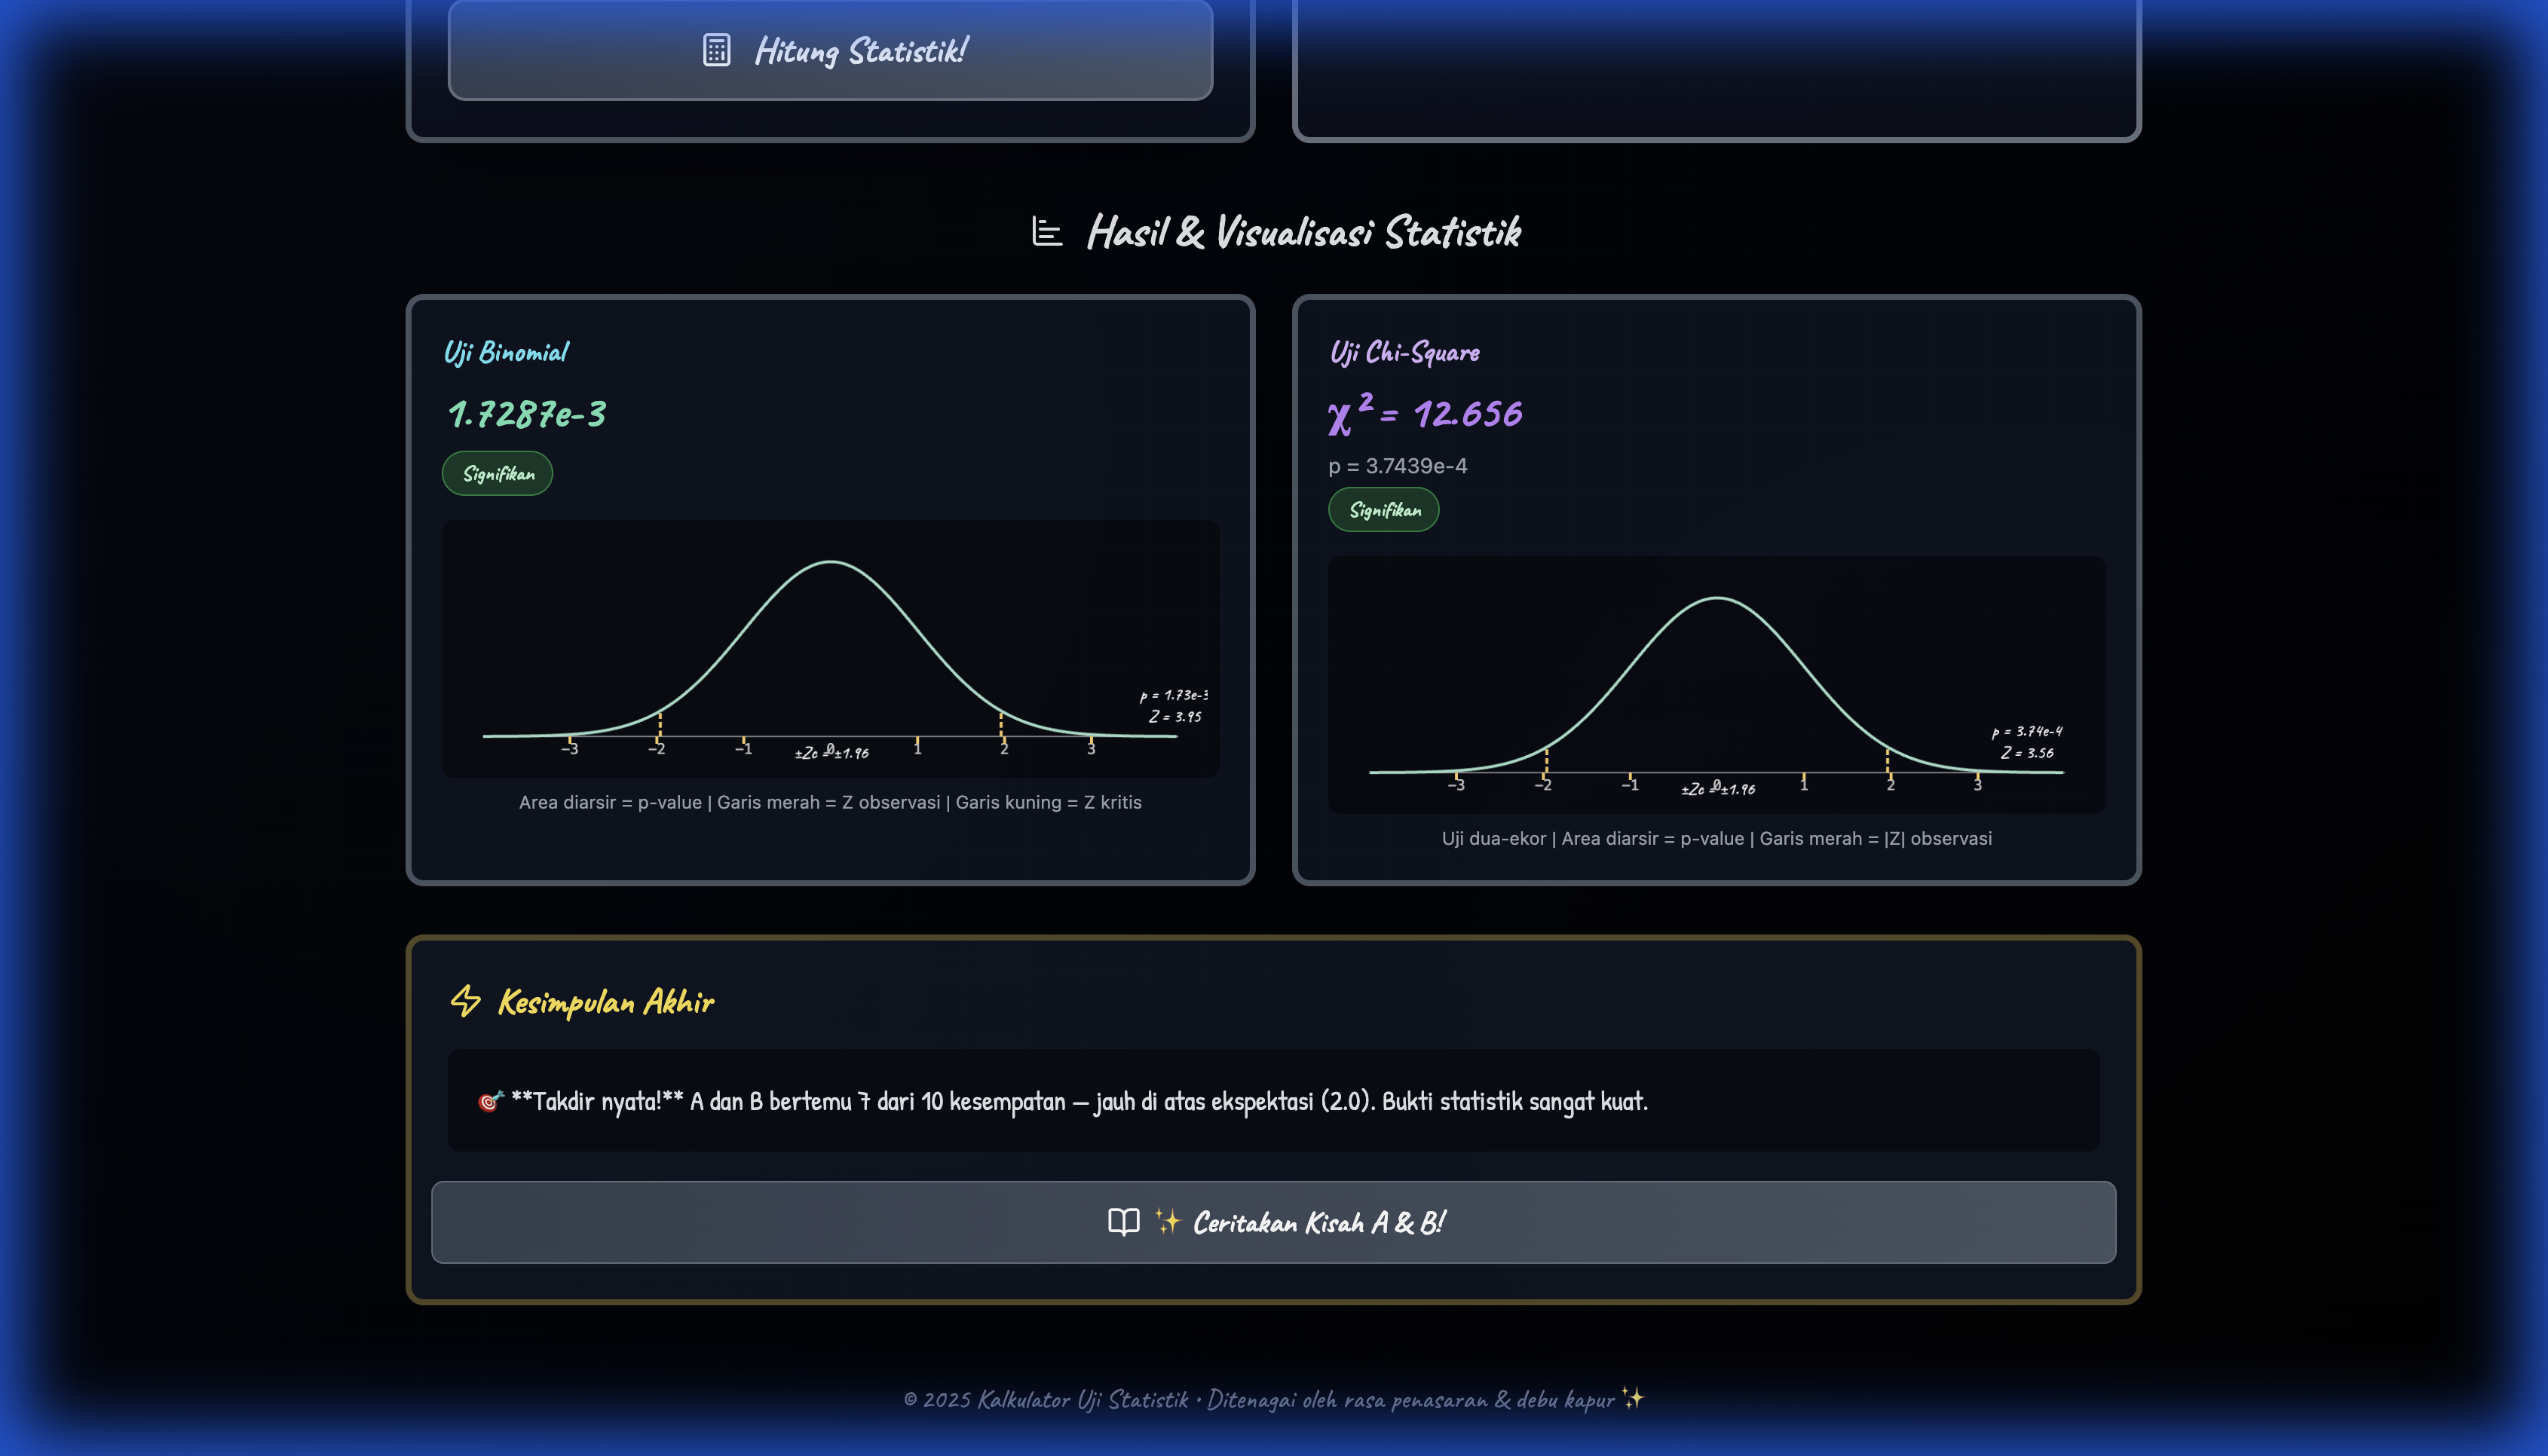
Statistical Engines: Full support for Binomial probability testing and Chi-square goodness-of-fit analysis. Canvas Visuals: Dynamic rendering of probability density functions, P-value shading, and threshold indicators. Fluid Motion: Implemented with Framer Motion for a responsive, high-end application feel.
Development Philosophy
Performance & Clarity
This project pushed the boundaries of React state management and coordinate-based rendering. By offloading heavy distribution calculations to the statistical engine and using the Canvas API for graphics, the app maintains 60fps even during complex parameter adjustments. It demonstrates that educational tools can be both mathematically sound and aesthetically stunning.
Next Step
Test the Hypothesis.
Explore the chalkboard-style calculator and visualize your statistical datasets in real-time.